
Correlation – Counterintuitive Results
Introduction
Raven users sometimes report that Raven Pro’s correlation feature reports correlations far different from what they were expecting. This article will explain some of the reasons for this.
Explanation #1
By default the correlation feature correlates the waveform view. If you want to correlate the spectrogram view, be sure to select “Spectrogram”.

Explanation #2
The way humans interpret the similarity of sound events in spectrograms is in many respects quite different from spectrogram correlation. A discussion of such differences follows.
Pixel-by-pixel comparison vs shape-based feature extraction
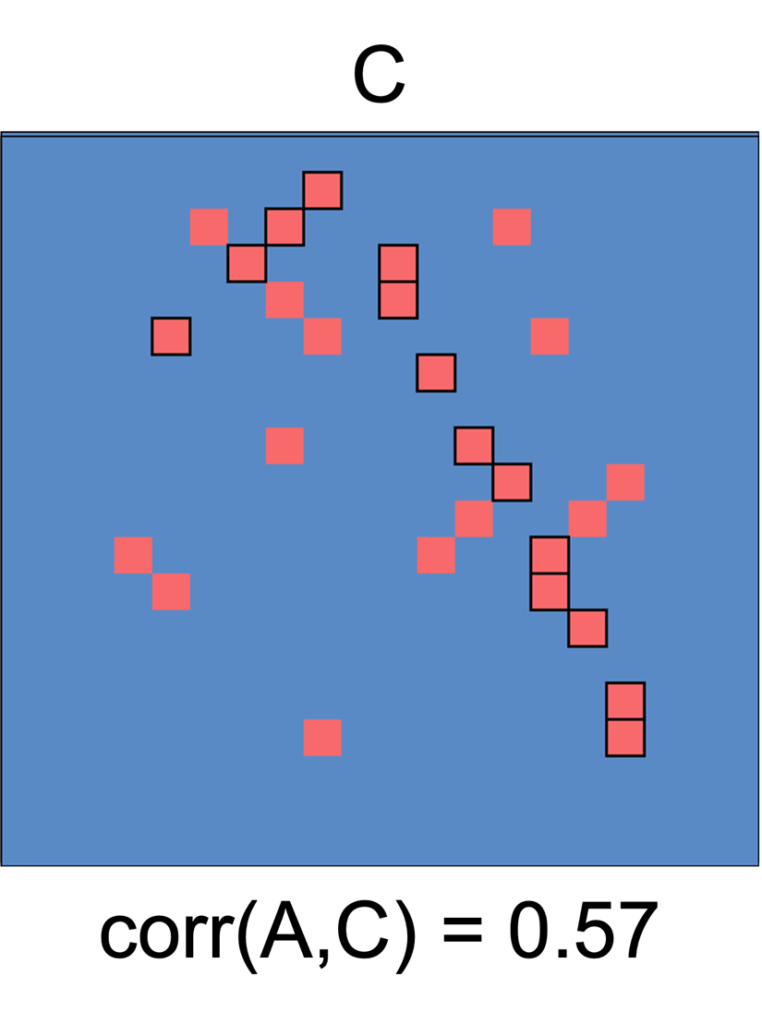
When we look at spectrograms, what we notice and pay attention to are shapes or patterns in signals, such as upsweeps, downsweeps, trills, repetition of elements, and the parameters or properties of those patterns, such as slope or repetition rate. This pattern recognition depends in complex ways on spatial relationships among the pixels in the 2-dimensional matrix of the spectrogram. But spectrogram correlation doesn’t see shapes or spatial relationships among pixels, it just compares images pixel-by-pixel, and computes similarities based on the pixel comparisons. This can sometimes result in similarity rankings that don’t agree with the shape-based rankings that our primate visual system provides. For an example, consider these three images, which represent spectrograms of three sounds:
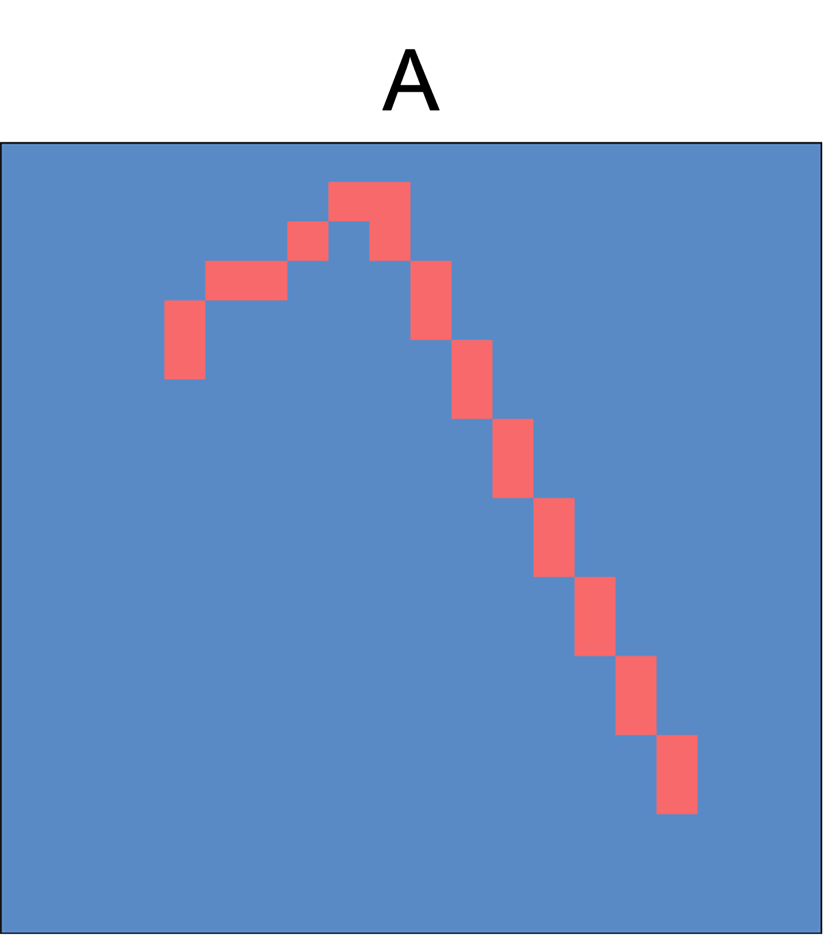
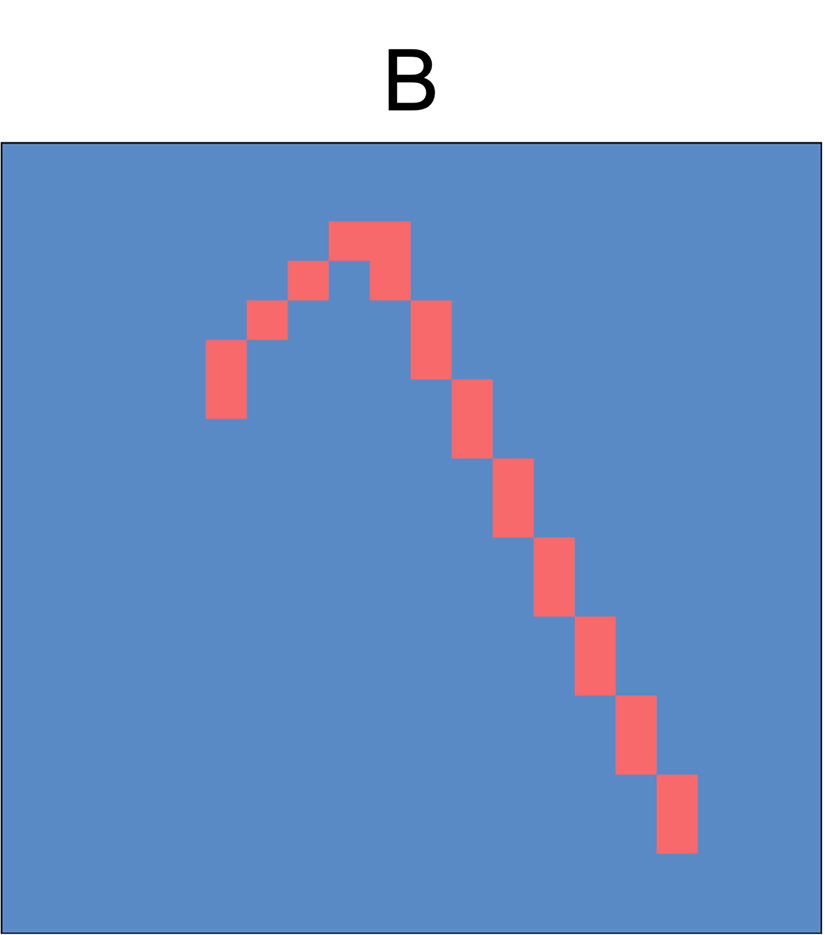
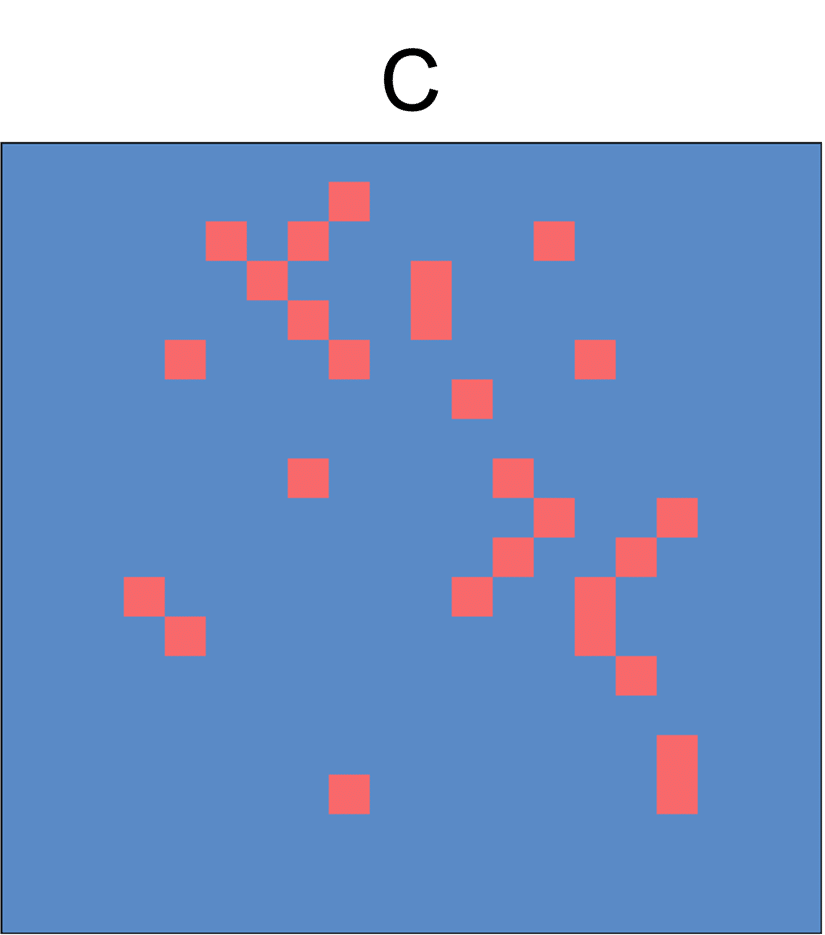
Which pair is more similar— (A,B) or (A,C)? Most primates would probably agree that A and B are much more similar to each other than A and C. The shapes described by the red cells are not identical, but they’re very close. Matrix C looks very different.
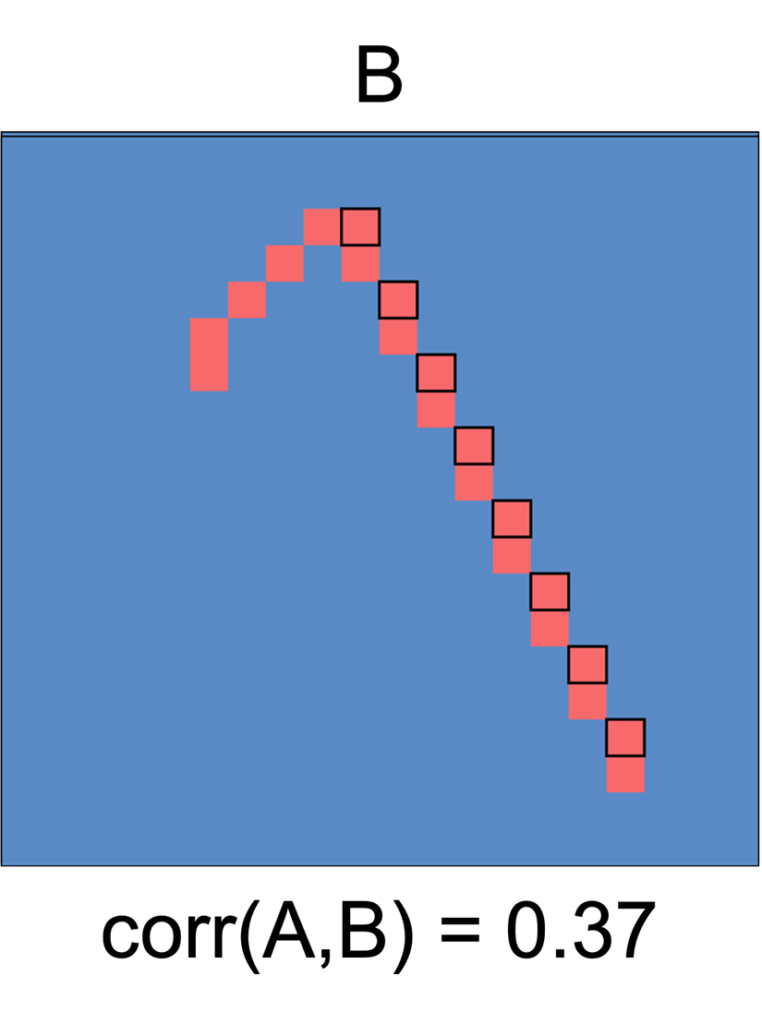
But if we compute the correlation between the two matrices (with red cells representing 1, and blue cells representing 0), we get corr(A,B) = 0.37, and corr(A,C) = 0.57. The correlation score is not affected by the shape. In this simple case, it’s just based on how many pixels line up between the matrices being compared. The pixels that match with signal A are shown here with black borders:
Effects of background noise
When we look at spectrograms, we automatically and subconsciously ignore the parts of the image that are obviously not part of the signal of interest—for example noise below or above our signal (like low-frequency noise from wind or cars, and high frequencies like insects above our bird or frog sounds). We also tend to ignore obvious noise within the signal band like distant overlapping sounds or reverberation of the signal. Once again, the correlation algorithm is very simple— by default every pixel in the image gets included in the computation. Depending on the situation, these noise pixels that aren’t part of the signals can either raise or lower the overall correlation. There are steps you can take in Raven to reduce the influence of noise:
Noise outside the signal band
When you run a batch correlation in Raven, you should always use the Band pass filter option in the setup dialog, and limit the correlation to the frequency band containing your signals.
Noise in the signal band
You can reduce background noise throughout the spectrogram, including in the signal band, by using Raven’s Spectrogram Clipping parameter in the Configure Spectrogram dialog. (Note that this parameter has nothing to do with the phenomenon of amplitude clipping, which creates distortions in a digital recording when the recording gain was set too high.). What this does is to set all spectrogram pixels (cells) below a specified dB threshold to zero power -infinity dB (or to some other very low dB value that you specify). This is a crude way of eliminating background noise.
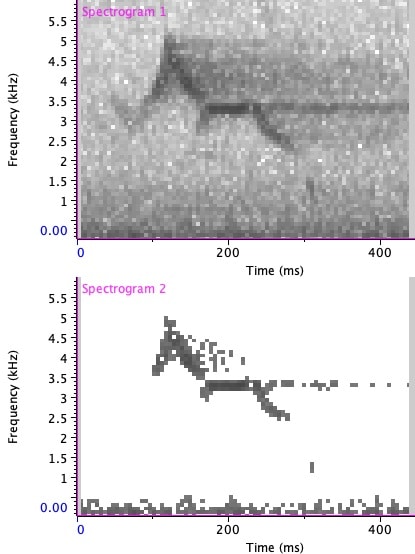
Here’s an example showing two spectrograms of a bird song syllable. Spectrogram 1 is made using Raven’s default parameters. Spectrogram 2 is the same except it has Clipping turned on, with a Clipping threshold set to clip values below 120 dB to No Power (-infinity dB). In the second one, the white pixels represent points of zero power (-∞ dB).
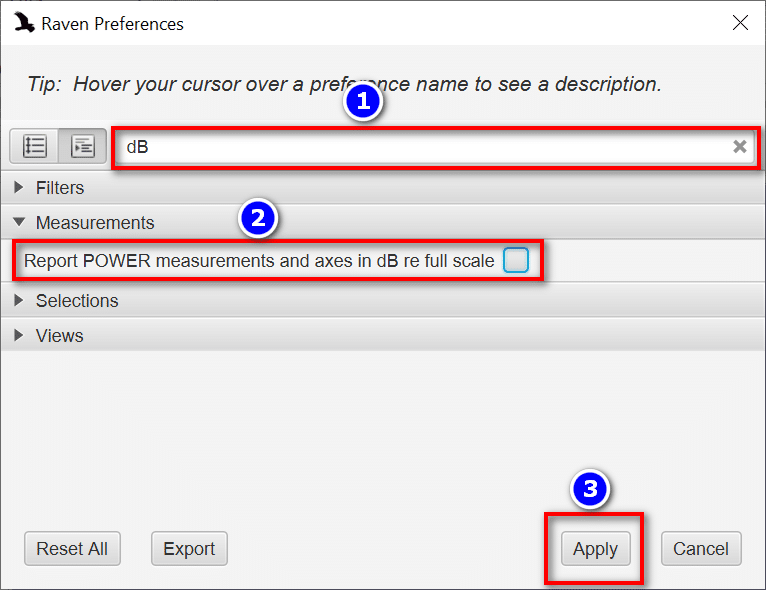
Choosing an appropriate Clipping threshold is something that you will just need to experiment with, to see what does a good job of getting rid of much of the background while leaving your signal intact. Once you’ve decided on a clipping threshold, you can enter that into the Configure Spectrogram dialog that you can access from within the Batch Correlation dialog. Also, due to a bug in the current version of Raven, you will need to turn off reporting of power values in dB Full Scale to use the spectrogram clipping feature. To do this, choose “Preferences” in the Edit menu and perform these three steps:
- Search for “dB”.
- Uncheck “Report POWER measurements and axes in dB re full scale”.
- Click Apply:
Taking these steps to reduce the effect of background noise in the spectrogram correlations might result in your correlations having values that make more sense in terms of your subjective ranking of similarity. But it might not, because of the very different ways that correlation and our complex visual neural networks rank similarity.