
Robust Signal Measurements
Introduction
The accuracy and precision of Raven measurements is influenced by a number of factors, including observer bias and signal characteristics. Part of the bias is related to ambiguity about where the “edges” of the signal is: when does it start and end, and how high and low in frequency does it extend. A few minutes of fiddling around with spectrogram parameters, or spectrogram brightness and contrast, should convince you that it is difficult to determine signal bounds in a spectrogram with any degree of precision.
Measurement Definitions
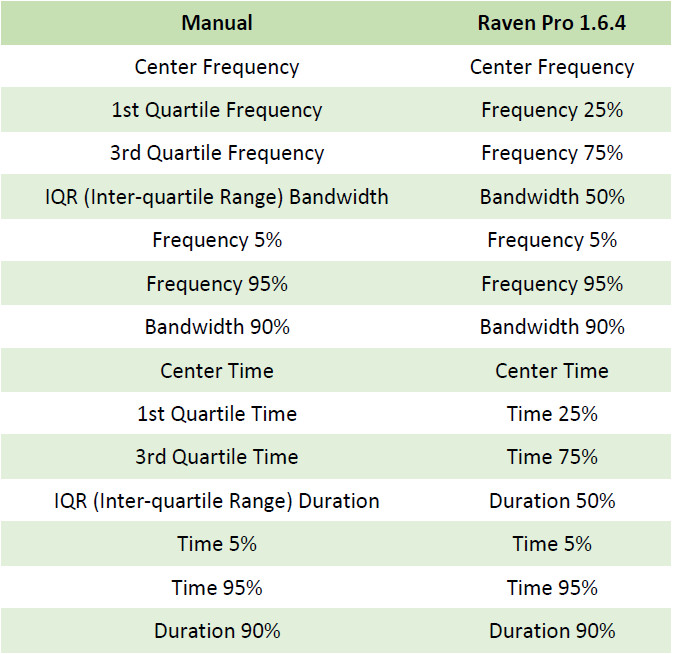
A description of Raven’s “robust signal measurements” can be found on pages 170 – 174 of the Raven Pro User’s Manual. Note that the names of some of these measurements has been changed since the Manual was published.
Theoretical Justification
For an in-depth description of the robustness of these measurements, and more detail regarding the research behind them, see Cortopassi (2006), Fristrup and Watkins (1992) and Fristrup and Watkins (1994).
Alternative Approach
You can find an excellent treatment of the need for robust signal measurements and an alternative approach to making them in:
Zollinger, S. A., et al., On the relationship between, and measurement of, amplitude and frequency in birdsong, Animal Behaviour (2012), http://dx.doi.org/10.1016/j.anbehav.2012.04.026.
PowerPoint Presentation
(from recent Sound Analysis Workshop)
This presentation from a recent Sound Analysis Workshop estimates inter-observer error for analysts’ manual estimation of signal bandwidth and duration and compares it to more robust estimates of bandwidth and duration. There is also an introduction to the Peak Frequency Contour (PFC) measurements.
If you can’t view the presentation, try a web browser recommended here.