
Frequency Contour and PFC Measurements
Introduction
Pitch tracking, that is, tracking the frequency of the predominant sound over time, is a popular feature requested by users. With Raven Pro 1.5 we introduced a number of “frequency contour measurements”.
How They Work
The general idea behind the frequency contour measurements is to take an existing Raven measurement and calculate it separately for each spectrogram slice. Often this results in a series of numbers, separated by semicolons, for each selection. For example, the Peak Frequency Contour measurement for a given selection reports the Peak Frequency measurement for each spectrogram slice in that selection (eg, 3186.9;3186.9;3186.9;3165.4;3186.9;3122.3;3100.8;3143.8).
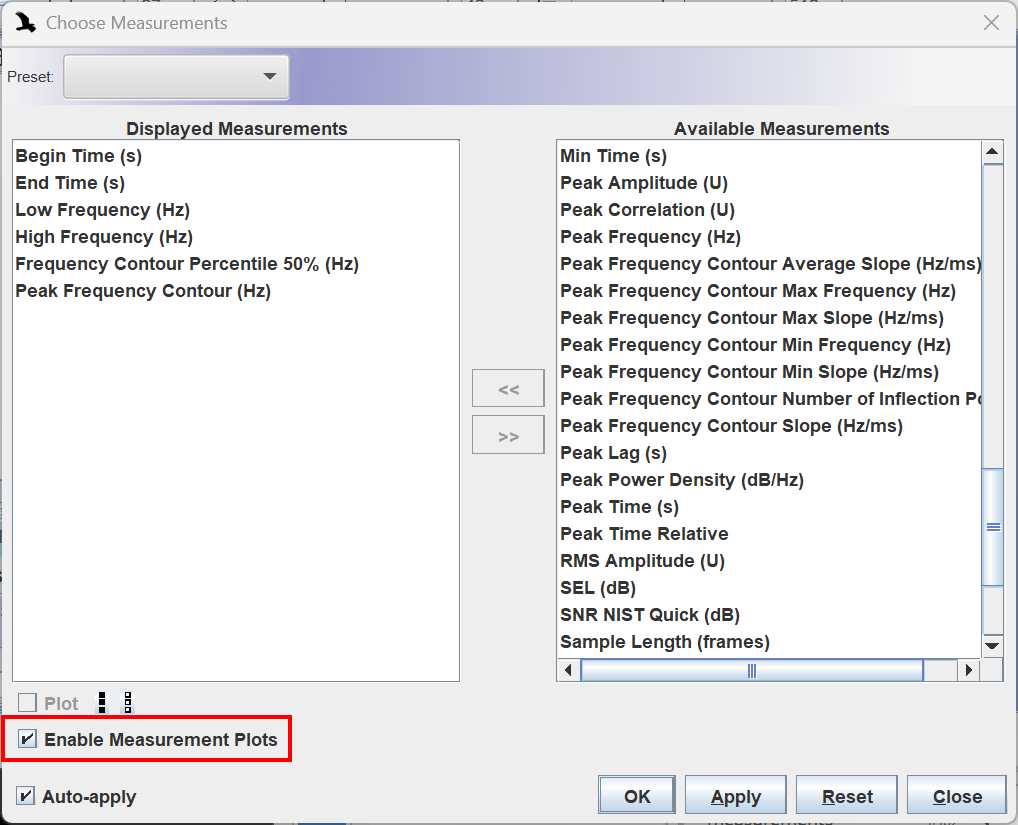
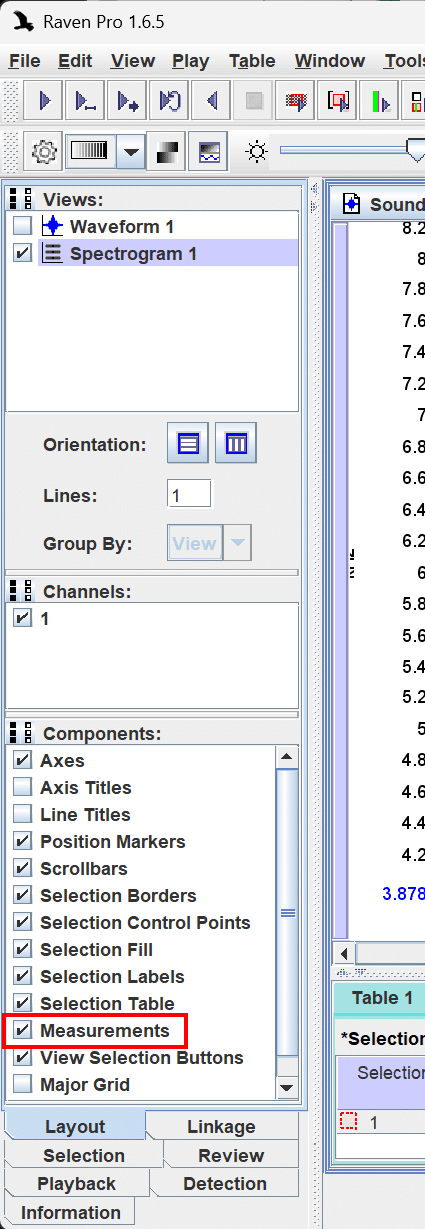
Many contour measurements are plottable, meaning that you can choose to plot the measurement for each selection on the spectrogram view as described on page 167 of the Raven Pro User’s Manual. Measurement plots can be enabled in two places.
Choose Measurements Dialog
Side Panel
The following is an exported Raven spectrogram configured with two commonly-used frequency contour measurement,Frequency Contour Percentile 50% and Peak Frequency Contour. The displayed recording is “BowheadWhaleSong.aif”, which you can find in the Raven Pro “Examples” folder.
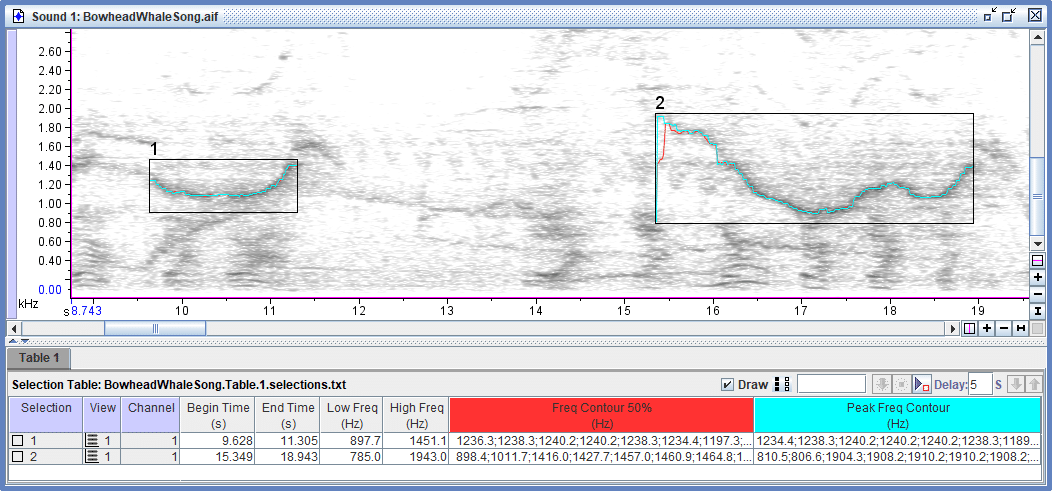
Note that the measurement values, and indeed the number of spectrogram slices within each selection, is dependent on your selection of spectrogram parameters.
Also note that adding too many frequency contour measurements can cause Raven’s user interface to become sluggish because each measurement may consist of dozens, dozens, or even thousands of values. If when working with contour measurements you find the user interface becoming unresponsive, consider reducing the number of selection spectrum measurements and/or the number of selections in your selection table.
List of Frequency Contour Measurements
- Frequency Contour Percentile 5%:Frequency 5% measurements for spectrogram slices
- Frequency Contour Percentile 25%: 1st Quartile Frequency measurements for spectrogram slices
- Frequency Contour Percentile 50%: Center Frequency measurements for spectrogram slices
- Frequency Contour Percentile 75%: 3rd Quartile Frequency measurements for spectrogram slices
- Frequency Contour Percentile 95%: Frequency 95% measurements for spectrogram slice
- Peak Frequency Contour: Peak Frequency measurements for spectrogram slices
- Peak Frequency Contour Slope: Difference between each pair of adjacent elements in Peak Frequency Contour
- Peak Frequency Contour Average Slope: Mean of the Peak Frequency Contour Slope
- Peak Frequency Contour Max Frequency: Maximum of the Peak Frequency Contour
- Peak Frequency Contour Min Frequency: Minimum of the Peak Frequency Contour
- Peak Frequency Contour Max Slope: Maximum of the Peak Frequency Contour Slope
- Peak Frequency Contour Min Slope: Minimum of the Peak Frequency Contour Slope Series
- Peak Frequency Contour Number of Inflection Points: Number of times the slope changes sign in Peak Frequency Contour Slope
Warning
Each cell in a Peak Frequency Contour measurement consists of many Peak Frequency measurements. Depending on the length of the selection, sample rate, and hop size, each cell may have dozens, hundreds, or even thousands of Peak Frequency measurements. Raven recalculates measurements more often than you might think, for example when saving a selection table. Selection tables with one or more Peak Frequency Contour measurements may take a long time to save, particularly if there are a lot of selections. When working with Peak Frequency Contour measurements, it is generally a good idea to limit the number of selections in each selection table.